Pressure Reversal Engine - Scalp [BullByte]PRESSURE REVERSAL ENGINE - SCALP
OVERVIEW
Pressure Reversal Engine - Scalp is a professional reversal indicator built for scalping and active trading on any market including Forex, CFDs, crypto, and stocks. This multi-engine buy sell signal system works without volume data, making it ideal for instruments where volume is unavailable or unreliable.
━━━━━━━━━━━━━━━━━━━━━━━━━━━━━━━━━━━━━━━━━━━
THE PROBLEM THIS INDICATOR SOLVES
Traditional reversal indicators and buy sell signal systems often struggle with:
- Dependence on volume data (unavailable for Forex pairs, CFD instruments, and many markets)
- Single-indicator approaches that generate excessive false signals and noise
- Static parameters that fail to adapt to changing volatility conditions
- Lack of confluence validation across multiple analytical dimensions
PRE Scalp addresses these limitations through a six-engine confluence architecture. Signals generate only when multiple independent analytical engines align, filtering noise while identifying potential reversal conditions across any timeframe.
━━━━━━━━━━━━━━━━━━━━━━━━━━━━━━━━━━━━━━━━━━━
DEVELOPMENT APPROACH - MULTI-ENGINE ARCHITECTURE - NOT A MASHUP
The Pressure Reversal Engine was developed to address specific limitations observed in traditional reversal detection and scalping indicator methods:
Challenge 1: Volume Dependency
Most reversal indicators require volume data, which is unreliable or unavailable for Forex, CFDs, indices, and many international instruments. The SAI engine was specifically designed to derive activity measurements purely from price action and candle structure.
Challenge 2: Single-Dimension Analysis
Individual indicators measuring only one aspect of price action generate excessive false signals. The multi-engine confluence approach requires confirmation across six independent analytical dimensions before generating buy or sell signals.
Challenge 3: Static Parameters
Fixed lookback periods fail during changing volatility conditions. The AVR engine dynamically adapts all parameters based on current market state, improving signal quality across different market environments.
Challenge 4: Subjective Pattern Recognition
Visual pattern identification is subjective and inconsistent. The DNA engine provides objective mathematical pattern matching with quantifiable scores for reversal candle detection.
Each engine addresses a specific analytical dimension. The confluence requirement emerged from observation that aligned signals across multiple engines produced significantly higher quality reversal identification than any single method.
━━━━━━━━━━━━━━━━━━━━━━━━━━━━━━━━━━━━━━━━━━━
THE SIX ANALYTICAL ENGINES EXPLAINED
Each engine provides a unique analytical perspective. Buy and sell signals generate only when multiple engines confirm confluence:
ENGINE 1: SYNTHETIC ACTIVITY INDEX (SAI) - Volumeless Activity Detection
Purpose: Derives market activity from price structure without requiring volume data. Essential for Forex trading, CFD analysis, and any instrument lacking reliable volume.
Calculation: Weighted composite of range expansion, body momentum, directional pressure, wick rejection, price acceleration, and volatility burst measurements.
Formula: SAI = (RangeExpansion x 0.25) + (BodyMomentum x 0.20) + (DirectionalPressure x 0.15) + (WickRejection x 0.15) + (PriceAcceleration x 0.15) + (VolatilityBurst x 0.10)
Signal Contribution: Validates that meaningful market activity is occurring at the potential reversal point. Without activity confirmation, apparent reversals may lack follow-through.
ENGINE 2: PRESSURE WAVE OSCILLATOR (PWO) - Exhaustion Detection
Purpose: Measures the balance between buying pressure and selling pressure through price geometry analysis.
Calculation: Net pressure (buying minus selling) weighted by activity level, normalized by standard deviation over extended period.
Formula: PWO = SMA(NetPressure x SAI, length) / StdDev(cumulative, length x 2)
Signal Contribution: Identifies pressure exhaustion conditions using percentile ranking to detect when buyers or sellers are running out of momentum. Exhaustion often precedes trend reversal.
ENGINE 3: FRACTAL CONFLUENCE MATRIX (FCM) - Multi-Timeframe Structure Analysis
Purpose: Analyzes price position across multiple structural timeframes simultaneously for multi-timeframe confluence.
Calculation: Evaluates price position within range at five Fibonacci-based periods (5, 8, 13, 21, 34 bars). These periods capture nested market structures from micro to macro.
Formula: FractalPosition = (Close - LowestLow) / (HighestHigh - LowestLow) at each period
Signal Contribution: Confirms that multiple structural levels align at extremes, indicating potential reversal zones where larger and smaller timeframes agree on price position.
ENGINE 4: ENTROPIC EXHAUSTION DETECTOR (EED) - Information Theory Analysis
Purpose: Applies Shannon entropy from information theory to measure market disorder and directional exhaustion.
Calculation: Shannon entropy of bullish/bearish bar distribution over the lookback period.
Formula: H = -Sum(p(x) x log2(p(x))) where p(x) is probability of bullish or bearish bars
Range: 0 (complete order, all bars same direction) to 1 (maximum disorder, 50/50 distribution)
Signal Contribution: High entropy combined with a directional streak breaking suggests the market has reached maximum uncertainty and may resolve in a new direction.
ENGINE 5: CANDLE DNA FINGERPRINTING - Pattern Recognition System
Purpose: Mathematical pattern recognition comparing current candle structure against ideal reversal patterns including hammer, shooting star, and engulfing formations.
Calculation: Weighted similarity scoring across body ratio, upper wick ratio, lower wick ratio, close position, and range versus ATR.
Formula: Score = Sum((1 - |actual - ideal|) x weight) for each metric
Signal Contribution: Identifies candles with reversal characteristics through objective mathematical measurement rather than subjective visual pattern recognition.
ENGINE 6: ADAPTIVE VOLATILITY REGIME (AVR) - Dynamic Parameter Adjustment
Purpose: Dynamically adjusts all lookback parameters based on current volatility conditions for adaptive indicator behavior.
Calculation: Ratio of fast ATR to slow ATR determines volatility regime classification.
Formula: VolatilityRatio = ATR(fast period) / ATR(slow period)
States: High volatility (ratio > 1.3) uses shorter lookbacks for faster adaptation. Low volatility (ratio < 0.7) uses longer lookbacks for noise reduction. Normal volatility maintains base parameters.
Signal Contribution: Ensures the entire system adapts appropriately to current market conditions rather than using static parameters that may fail in different environments.
━━━━━━━━━━━━━━━━━━━━━━━━━━━━━━━━━━━━━━━━━━━
WHY ENGINE SYNERGY MATTERS FOR SIGNAL QUALITY
The effectiveness of PRE comes from requiring multiple engines to align before generating buy or sell signals:
- SAI confirms activity is present (something meaningful is happening in price action)
- PWO confirms pressure exhaustion (the current move is running out of steam)
- FCM confirms structural alignment (multiple timeframes agree on position)
- EED confirms disorder state (market uncertainty is elevated near potential turning point)
- DNA confirms candle structure (the bar exhibits reversal pattern characteristics)
- AVR ensures parameters are appropriate (system is calibrated to current volatility)
A single indicator measuring one dimension generates many false signals. By requiring confluence across six independent analytical dimensions, this reversal indicator filters noise while identifying potential trading opportunities.
━━━━━━━━━━━━━━━━━━━━━━━━━━━━━━━━━━━━━━━━━━━
SIGNAL GENERATION PROCESS FOR BUY AND SELL SIGNALS
Step 1: ANCHOR DETECTION
The system identifies potential reversal anchors when price breaks beyond recent structure using a mean-reversion approach. A bullish anchor forms when price breaks below prior lows, suggesting potential oversold conditions. A bearish anchor forms when price breaks above prior highs, suggesting potential overbought conditions.
Step 2: ENGINE SCORING
Each enabled engine contributes to a cumulative quality score. The anchor must achieve minimum scoring thresholds to activate a setup.
Step 3: CONFIRMATION TRIGGER
Price must confirm the setup by crossing back through the anchor zone within the confirmation window. This crossover or crossunder is validated at bar close to prevent repainting.
Step 4: SIGNAL QUALITY SCORE
The final buy or sell signal displays a quality score representing the total engine confluence. Higher scores indicate stronger alignment across more analytical engines.
━━━━━━━━━━━━━━━━━━━━━━━━━━━━━━━━━━━━━━━━━━━
READING THE BUY SELL SIGNAL LABELS
BUY Signal Label:
- Displays "BUY" with quality score in brackets
- Shows engine contribution breakdown when enabled in settings
- indicates engine contributed to signal
- indicates engine did not contribute
- Higher total scores suggest stronger multi-engine confluence
SELL Signal Label:
- Displays "SELL" with quality score in brackets
- Same engine breakdown format as BUY signals
- Identical scoring interpretation
Score Interpretation Guide:
- Score 3-4: Minimum threshold met, basic confluence achieved
- Score 5-6: Good confluence across multiple engines
- S core 7-8: Strong confluence with most engines aligned
━━━━━━━━━━━━━━━━━━━━━━━━━━━━━━━━━━━━━━━━━━━
ENGINE STATUS DASHBOARD - REAL-TIME ANALYSIS DISPLAY
The Engine Status Panel displays real-time readings from all six analytical engines:
Synthetic Activity Row:
- HIGH ACTIVITY: SAI above threshold, significant price action detected (value shown)
- ACTIVE: SAI above confirmation level, moderate activity present
- LOW: SAI below activity thresholds, quiet market conditions
- DISABLED: Engine turned off in settings
Pressure Wave Row:
- BULL EXHAUSTION: PWO in lower percentile tail and reversing upward, potential bottom
- BEAR EXHAUSTION: PWO in upper percentile tail and reversing downward, potential top
- NEUTRAL: PWO in normal range, no exhaustion detected
Fractal Matrix Row:
- BULL CONFLUENCE: Multiple fractal levels show price near structural lows (score shown)
- BEAR CONFLUENCE: Multiple fractal levels show price near structural highs
- NO CONFLUENCE: Insufficient alignment across fractal timeframe levels
Entropic Exhaustion Row:
- HIGH ENTROPY: Shannon entropy above threshold, maximum market disorder detected
- ORDERED: Entropy below threshold, clear directional consistency present
Candle DNA Row:
- BULL PATTERN: Current candle matches bullish reversal profile (hammer-like structure)
- BEAR PATTERN: Current candle matches bearish reversal profile (shooting star-like)
- NO MATCH: Current candle does not match reversal pattern characteristics
Market Regime Row:
Shows DETECTED market conditions based on price action analysis:
- FRESH MOVE: New directional move beginning, momentum increasing
- NORMAL: Standard market conditions, no extreme factors detected
- SCALP CONDITIONS: Extended move or decreasing momentum detected
- CAUTION ZONE: Multiple warning factors present requiring conservative approach
Note : This displays what market conditions look like, not necessarily what targets will be applied.
Applied Style Row:
Shows what target style is ACTUALLY being applied to trades and why:
When Trade Style Setting = Auto:
- RUNNER (Auto): System detected FRESH conditions, applying wide targets (0.8R, 1.8R, 3.0R)
- EXTENDED (Auto): System detected NORMAL conditions, applying balanced targets (0.6R, 1.2R, 2.0R)
- SCALP (Auto): System detected SCALP conditions, applying tight targets (0.4R, 0.8R, 1.2R)
- CAUTION (Auto): System detected CAUTION conditions, applying very tight targets (0.3R, 0.5R, 0.8R)
When Trade Style Setting = User Override:
- SCALP (User): You selected Scalp style manually
- EXTENDED (User): You selected Extended style manually
- RUNNER (User): You selected Runner style manually
This dual-row display ensures complete transparency. You always see both what market conditions exist AND what targets you are receiving.
Volatility State Row:
- HIGH VOLATILITY: Fast ATR significantly exceeds slow ATR, adaptive parameters shortened
- NORMAL: Volatility ratio within standard range
- LOW VOLATILITY: Fast ATR significantly below slow ATR, adaptive parameters extended
━━━━━━━━━━━━━━━━━━━━━━━━━━━━━━━━━━━━━━━━━━━
REGIME VS APPLIED STYLE - COMPLETE TRANSPARENCY
The Engine Status Panel displays TWO separate rows for complete trading transparency:
1. Market Regime: What current market conditions look like based on analysis
2. Applied Style: What target calculations are actually being used for trades
Why Two Separate Rows?
When Trade Style is set to "Auto", the Applied Style will match the detected Regime automatically. For example:
- Regime: FRESH MOVE leads to Applied Style: RUNNER (Auto)
- Regime : NORMAL leads to Applied Style: EXTENDED (Auto)
When you manually select a Trade Style (Scalp, Extended, or Runner), the Applied Style will show your selection regardless of the detected Regime:
- Regime: FRESH MOVE but Applied Style: SCALP (User)
(Market conditions look fresh, but you chose tight targets)
This transparency ensures you always know:
- What conditions is the market is currently showing
- What targets you will you actually receive on signals
- Whether the system chose automatically or you overrode the selection
━━━━━━━━━━━━━━━━━━━━━━━━━━━━━━━━━━━━━━━━━━━
TRADE PANEL - POSITION MANAGEMENT DISPLAY
During Active Trade:
- Position type (LONG/SHORT) with entry price level
- Running P&L displayed in points (current price versus entry)
- TP1, TP2, TP3 target levels with booking percentages for each
- Current stop loss level (initial, protected, or trailing depending on trade progress)
- Risk to Reward ratio (displayed before TP1 is reached)
- Profit booked percentage showing locked gains
- Trade status and total bars in trade count
When Scanning for Signals:
- Shows "SCANNING FOR SIGNALS" status message
- Displays any active setup waiting for a confirmation trigger
- Shows next signal TP multipliers based on the current detected regime
- Indicates remaining bars in confirmation window before setup expires
━━━━━━━━━━━━━━━━━━━━━━━━━━━━━━━━━━━━━━━━━━━
TRADE MANAGEMENT AND RISK CONTROL FEATURES
Take Profit System:
- Supports 2 or 3 TP target levels for flexible exit strategy
- Three calculation modes available: Auto (regime-based), Manual ATR, Fixed R:R
- Configurable booking percentages at each level for position scaling
- Visual lines and labels display all target levels on chart
Stop Loss System:
- Two calculation modes : Auto (anchor-based) or Manual ATR distance
- Configurable buffer beyond calculated stop level for additional protection
- Optional maximum stop loss cap in points to limit risk exposure
- Visual display shows current stop level throughout trade
Breakeven Protection:
- None: Stop remains at original level after TP1 is reached
- Buffer: Stop moves to entry plus percentage of original risk
- Lock at TP1: Stop moves to TP1 level, securing that profit amount
Trailing Stop Options:
- ATR Trailing: Follows at dynamic ATR distance from price extreme
- Step Trailing: Moves in fixed point increments as price advances favorably
- Swing Trailing: Follows recent swing structure levels for dynamic protection
- Configurable start point: Begin trailing from entry or only after TP1 achieved
━━━━━━━━━━━━━━━━━━━━━━━━━━━━━━━━━━━━━━━━━━━
KEY SETTINGS GUIDE FOR CONFIGURATION
Core Engine Settings:
- Base Lookback Period: Foundation for anchor detection, automatically adjusted by AVR engine
- Confirmation Window: Number of bars allowed for price to confirm setup after anchor
- Minimum Signal Quality Score : Required confluence level for valid buy sell signals
- Signal Cooldown: Minimum bars between consecutive signals to prevent clustering
Engine Toggles:
Each of the six analytical engines can be independently enabled or disabled. Disabling engines reduces confluence requirements but may affect overall signal quality.
Trade Style Options:
- Auto: Automatically selects style based on detected market regime
(FRESH leads to Runner, NORMAL leads to Extended, SCALP leads to Scalp, CAUTION leads to Caution)
- Scalp: Forces tight targets for quick profit taking (TP1: 0.4R, TP2: 0.8R, TP3: 1.2R)
- Extended: Forces balanced targets with room to develop (TP1: 0.6R, TP2: 1.2R, TP3: 2.0R)
- Runner: Forces wide targets to capture larger moves (TP1: 0.8R, TP2: 1.8R, TP3: 3.0R)
Aggressiveness Level:
- Conservative: Tighter targets with earlier profit taking
- Normal: Balanced approach as calculated
- Aggressive: Extended targets for larger potential moves
Session Filter:
Optional restriction of signals to specific trading sessions including London, New York, Tokyo, Sydney, London plus New York overlap, or custom hours in UTC.
━━━━━━━━━━━━━━━━━━━━━━━━━━━━━━━━━━━━━━━━━━━
VISUAL ELEMENTS AND DISPLAY OPTIONS
Chart Display Elements:
- BUY and SELL labels with quality scores and optional engine breakdown
- Entry line displayed as dashed yellow
- TP levels displayed as dotted green gradient
- Stop loss line displayed as solid red
- Protected and trailing stop line displayed as solid blue
- Hit markers appear when TP or SL levels are reached
- Optional regime label showing current market state classification
Color Theme Options:
- Vibrant: High contrast modern colors (default selection)
- Classic : Traditional trading platform colors
- Dark Pro: Subdued professional color scheme
- Minimal : Low saturation subtle colors for clean charts
Dashboard Display Modes:
- Full : Complete detailed information display
- Compact : Essential information only for smaller footprint
- Ultra Compact : Minimal footprint display for maximum chart space
━━━━━━━━━━━━━━━━━━━━━━━━━━━━━━━━━━━━━━━━━━━
ALERT SYSTEM FOR NOTIFICATIONS
Individual Alert Conditions Available:
- PRE Buy Signal: Triggers on new buy signal generation
- PRE Sell Signal: Triggers on new sell signal generation
- TP1 Achieved: Triggers when first target is reached
- TP2 Achieved: Triggers when second target is reached
- TP3 Achieved: Triggers when third target is reached
- Stop Loss Hit: Triggers when stop level is reached before any TP
- Protected Exit: Triggers when stop is hit after partial profit taken
- Momentum Warning: Triggers when momentum weakening is detected in profitable trade
Alert Format Options:
- Standard: Brief notification with symbol and signal score
- Detailed : Comprehensive information including all price levels
- Webhook JSON: Machine-readable format for automated trading systems and bots
━━━━━━━━━━━━━━━━━━━━━━━━━━━━━━━━━━━━━━━━━━━
CHART EXAMPLES - VISUAL DEMONSTRATIONS
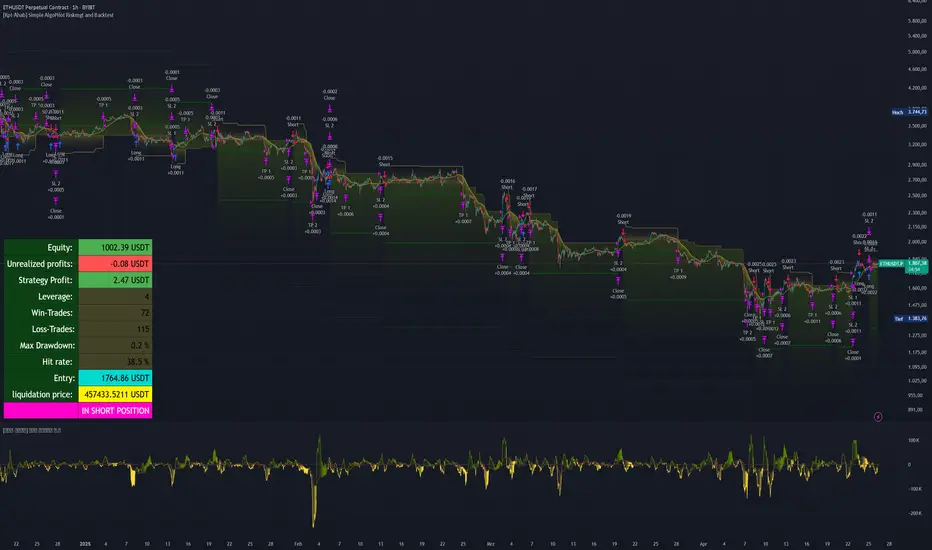
Chart 1: Dashboard and Engine Status Overview
This chart demonstrates the PRE indicator in scanning mode, showing the comprehensive Engine Status Panel (top right) and Trade Panel (bottom right). The dashboard provides real-time visibility into all six analytical engines and current market conditions.
Key Features Shown:
- Synthetic Activity Index (SAI): Currently showing HIGH ACTIVITY (50.6) detecting significant price action
- Pressure Wave Oscillator (PWO): NEUTRAL (2.99) with no exhaustion detected yet
- F ractal Confluence Matrix (FCM): BEAR CONFLUENCE (5) showing price at multi-timeframe highs
- Entropic Exhaustion Detector (EED): HIGH ENTROPY (0.99) indicating maximum market uncertainty
- Candle DNA Fingerprinting: BULL PATTERN (0.74) with reversal pattern detected
- Market Regime: SCALP CONDITIONS suggesting tighter targets appropriate
- Applied Style: SCALP (Auto) with system automatically selecting scalp mode based on regime
- Volatility State: NORMAL (0.76)
- Trade Panel: Shows SCANNING FOR SIGNALS with a BEARISH setup active (3 bars remaining)
What This Demonstrates:
The dashboard provides complete transparency into the indicator decision-making process. You can see exactly which engines are active, their current readings, and what trade style will be applied to the next signal. The Applied Style row shows both the detected regime AND the style that will be used.
Chart 2: Trade Style Comparison - Extended vs Runner
This split-screen comparison shows the SAME SELL signal and trade with two different trade style settings applied. The left panel uses EXTENDED (User) style while the right panel uses RUNNER (User) style. This demonstrates how manually selecting different trade styles affects take profit targets and position booking strategy for identical market conditions.
Key Features Shown:
LEFT PANEL - EXTENDED (User) Style:
- Engine Status: Market Regime shows FRESH MOVE but Applied Style shows EXTENDED (User)
- Entry: 4492.5
- TP1: 4487.75 at 4.6 pts away
- TP2: 4483.01 at 9.4 pts away
- Stop Loss: 4500.4 (8 pts)
- Risk to Reward: 1:0.6
- Running P&L: -0.13 points
- Position Booking: Balanced 50/50 split
RIGHT PANEL - RUNNER (User) Style:
- Engine Status: Same FRESH MOVE regime but Applied Style shows RUNNER (User)
- Entry: 4492.5 (same entry)
- TP1: 4486.17 at 6.2 pts away (WIDER target)
- TP2: 4478.26 at 14.1 pts away (MUCH WIDER target)
- Stop Loss: 4500.4 (8 pts - same stop)
- Risk to Reward: 1:0.8 (better ratio)
- Running P&L: -0.13 points (same moment)
- Position Booking: Aggressive 35/65 split keeping more for runner
What This Demonstrates:
Both panels show the exact same trade at the same moment with same P&L, entry, and stop. The ONLY difference is the trade style setting. EXTENDED uses balanced approach with 50/50 booking at closer targets. RUNNER uses wider targets with 35/65 booking to let winners run further.
Chart 3: Auto Mode vs Manual Override Comparison
This split-screen comparison shows the SAME SELL signal with two different style control modes. The left panel uses RUNNER (Auto) where the system automatically selected Runner style based on detecting FRESH MOVE conditions. The right panel uses SCALP (User) where the trader manually forced Scalp style, overriding the system recommendation.
Key Features Shown:
LEFT PANEL - RUNNER (Auto) Style:
- Engine Status: Market Regime shows FRESH MOVE and Applied Style shows RUNNER (Auto)
- Entry: 4492.5
- TP1: 4489.33 at 3 pts away
- TP2: 4487.17 at 6.2 pts away
- Stop Loss : 4500.4 (8 pts)
- Control Mode: System automatically selected this style
RIGHT PANEL - SCALP (User) Style:
- Engine Status: Same FRESH MOVE regime but Applied Style shows SCALP (User)
- Entry: 4492.5 (same)
- TP1: 4489.33 at 3 pts away (TIGHTER booking percentage)
- TP2: 4487.17 at 6.2 pts away (SMALLER remainder)
- Risk to Reward: 1:0.4 (more conservative)
- Control Mode: User manually forced this style overriding system
What This Demonstrates:
The Applied Style row shows WHO is in control. (Auto) means system decides based on regime. (User) means you override. This complete transparency shows when you are trading WITH or AGAINST the system analysis.
Chart 4: Trade Management and Protection System
This split-screen comparison shows the SAME SHORT trade at DIFFERENT stages of execution. The left panel shows the trade at entry and setup phase while the right panel shows the trade after TP1 has been hit with protection activated.
Key Features Shown:
LEFT PANEL - Trade Setup and Initial Entry:
- Engine Status: Market Regime shows FRESH MOVE and Applied Style shows RUNNER (Auto)
- Trade Panel: Shows SCANNING FOR SIGNALS with BULLISH setup active (3 bars remaining)
- TP Mode: Auto with Next Signal TP showing 0.8R / 1.8R (Runner style targets)
- Exit Marker: Shows Exit @ +50% label indicating completed previous trade
- Setup Phase: System ready for next signal with runner-focused targets pre-calculated
RIGHT PANEL - Active Trade with TP1 Hit:
- Engine Status: Same FRESH MOVE regime but Applied Style shows SCALP (User)
- Entry: 4492.5 (yellow dashed line)
- TP1: 4486.17 showing + HIT (green marker indicating TP1 reached)
- TP2: 4486.17 at 11.4 pts away (green dotted line)
- Protected Stop: 4491.31 (3.8 pts) shown as BLUE LINE (stop moved from initial level)
- Running P&L: +4.96 points (in profit)
- Profit Booked: 65% shown in trade panel
- Trade Status: RUNNING TO TP2
- Bars in Trade: 10
- Protection Active: Stop loss moved to protect profits after TP1 achievement
What This Demonstrates:
Complete trade lifecycle and protection system. Initial stop placement, TP1 achievement, breakeven protection activation, position booking, and remaining position management with zero risk after partial profit taken.
━━━━━━━━━━━━━━━━━━━━━━━━━━━━━━━━━━━━━━━━━━━
RECOMMENDED USE CASES AND APPLICATIONS
Suitable Instruments:
- Forex pairs including all majors, minors, and exotics (no volume required)
- CFD instruments including indices, commodities, and metals
- Cryptocurrency pairs on all exchanges
- Stocks and ETFs with or without volume consideration
- Futures contracts across all markets
Suggested Timeframes:
- Primary for scalping: 1-minute, 3-minute, 5-minute, 15-minute charts
- Also effective on: 30-minute, 1-hour, 4-hour for swing entry identification
Optimal Conditions:
- Markets with clear structure and adequate liquidity
- During active trading sessions with participation
- When multiple engines show alignment and confluence
━━━━━━━━━━━━━━━━━━━━━━━━━━━━━━━━━━━━━━━━━━━
LIMITATIONS AND IMPORTANT CONSIDERATIONS
What This Indicator Cannot Do:
- Predict future price movements with certainty
- Guarantee profitable trades or specific returns
- Replace proper risk management and position sizing
- Work effectively in all market conditions at all times
- Eliminate all false signals completely
Conditions Where Performance May Vary:
- Extremely low liquidity periods with wide spreads
- Major news events and high-impact economic releases
- Strongly trending markets without meaningful pullbacks
- Unusual market conditions or flash crash events
The P&L tracking displayed is for the current visualized trade only and does not represent historical performance, backtested results, or guaranteed future outcomes.
━━━━━━━━━━━━━━━━━━━━━━━━━━━━━━━━━━━━━━━━━━━
SIGNAL CONFIRMATION AND NON-REPAINTING BEHAVIOR
This indicator is specifically designed to prevent repainting:
- All signals are confirmed at bar close only using barstate.isconfirmed
- Signals do not appear and disappear during intra-bar price action
- Once a signal prints on the chart, it remains permanently
- Historical signals accurately represent what would have been visible in real-time trading
━━━━━━━━━━━━━━━━━━━━━━━━━━━━━━━━━━━━━━━━━━━
RISK DISCLAIMER AND IMPORTANT NOTICES
This indicator is provided for educational and informational purposes only. It does not constitute financial advice, investment recommendations, or trading signals that guarantee profits.
Trading financial instruments carries substantial risk of loss and is not suitable for all investors. Past performance of any trading system or methodology is not necessarily indicative of future results.
Users should:
- Conduct their own analysis before making any trading decisions
- Never risk more than they can afford to lose
- Understand that no indicator can predict market movements with certainty
- Use proper risk management and position sizing at all times
- Consider consulting a licensed financial advisor before trading
The author accepts no liability for any losses incurred through the use of this indicator.
-BullByte
Indicatore Pine Script®